Smart Meter Disaggregation
This blog entry is part of a series of posts introducing the topic of smart meter disaggregation. In previous posts we’ve looked at the wider reasons for wanting to reduce energy consumption and we’ve taken a brief look at smart meters. In the following blog post, I want to introduce the concept of smart meter disaggregation, also known as “non-intrusive load monitoring” or NILM for short1{#footnoteref1_thfpd27 .see-footnote}. The main aim of smart meter disaggregation is to infer two things from a smart meter signal: 1) which appliances are active in the signal and 2) how much energy has each device consumed. This blog post will summarise the arguments for disaggregation and we’ll look at some of the main challenges.
Why might disaggregated smart meter data be useful to anyone?
Let us assume that people are motivated to improve their energy management. Do they have a sufficiently quantitative understanding of their energy consumption to prioritise correctly?
Prior to the availability of mains energy supplies, most individuals would have had an intuitive, quantitative understanding of the amount of energy consumed by the household. If the stove needed more fuel then someone had to manually shovel solid fuel into it; you couldn’t help but notice how much energy was being consumed. In this situation, most individuals would have an intuitive feel for how much energy it took to, say, heat the living room for one evening or cook one meal.
In today’s industrialised societies, we do not have such a concrete, tangible understanding of the amount of energy we use. It is a miracle of civil engineering that the energy equivalent of 3 tonnes of coal2{#footnoteref2_ozpa89k .see-footnote} is delivered into our homes every year without any noise, any manual labour, any dust, any inconvenience for us.
When we turn on an electrical device, it just works, without any indication of how much energy it’s consuming. Hence, when faced with rising electricity bills, we struggle to prioritise correctly when deciding which devices to turn off or replace.
Studies on residential energy users show that the vast majority are poor at estimating either the consumption of individual devices or their total aggregate consumption. Residents often underestimate the energy used by heating and overestimate the consumption of perceptually salient devices like lights and televisions (Kempton et al, 1982). Residents’ failure to correctly estimate energy consumption leads to higher total consumption.
How significant is occupant behaviour in determining total energy usage? Energy use can differ by two or three times among identical homes with similar appliances occupied by people from similar demographics (Socolow, 1978; Winett & Neale, 1979; Seryak & Kissock, 2003). These large differences in energy consumption are attributed to differences in consumption behaviour. If the home provided better feedback about which devices used the most energy then users could tweak their behaviour to make more efficient use of appliances.
Studies have investigated which types of energy feedback information displays (smart meters) are most successful in altering behaviour. Fischer (2008) found that “the most successful feedback combines the following features: it is given frequently and over a long time, provides an appliance-specific breakdown, is presented in a clear and appealing way, and uses computerized and interactive tools.” (my emphasis). Darby (2006) reports that direct feedback normally reduces energy consumption by 5-15%. Disaggregated data is also of use to utility companies as it helps with load forecasting.
Providing consumers with disaggregated consumption data can play a part in decreasing primary energy demand.
What actions can be taken to reduce energy consumption?
Say we’re successful in creating a useful disaggregation system. How could people use this information to reduce cost & CO2 output?
- replace appliances with efficient versions
- change behaviour
- reduce total consumption (needn’t reduce comfort)
- shift consumption to times when grid’s CO2 intensity is low (when the wind is blowing)
Two frequently asked questions about disaggregation
Before going any further, let me tackle two questions which you may have at this point:
1) Why bother doing disaggregation; wouldn’t it be easier to measure the power consumption of individual appliances using smart plugs? {#why-bother-doing-disaggregation-wouldnt-it-be-easier-to-measure-the-power-consumption-of-individual-appliances-using-smart-plugs style=”margin-top: 1em; margin-right: 0px; margin-bottom: 0.5em; margin-left: 0px; font-weight: bold; “}
Smart plugs can be inserted between an appliance and the mains socket; the smart plug can then measure the power consumption of the appliance. Yes, it would be conceptually easier to use smart plugs for all appliances in the home. But it would be far more expensive: each smart plug costs at least £25; and most homes have around 20 appliances. So it would cost £500 per house. And tedious to install. And some appliances are hard-wired into the mains. This solution simply won’t scale: by 2019, every house will have a smart meter; yet only a tiny, tiny fraction of the population would be at all interested in installing smart plugs for every appliance.
2) Won’t every appliance be connection to the Internet in the not-too-distant future? {#wont-every-appliance-be-connection-to-the-internet-in-the-not-too-distant-future style=”margin-top: 1em; margin-right: 0px; margin-bottom: 0.5em; margin-left: 0px; font-weight: bold; “}
Maybe; maybe not. Even if every appliance on the market tomorrow were able to connect to the Internet, it would still take decades before every appliance in the country was replaced with a network-connected appliance. However, it’s worth pointing out that adding a few network-connected appliances will make the disaggregation problem easier because the state of those network-connected appliances can be empirically measured and hence wont need to be estimated by the disaggregation system.
The basic aim of smart meter disaggregation
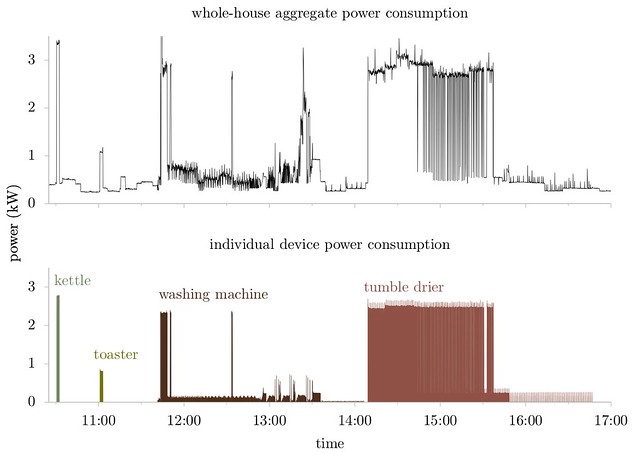
Let’s look at some real data to get a feel for what smart meter disaggregation involves:
The top trace in the graph above shows the signal from my Current Cost home energy monitor over the course of an afternoon. The top trace shows the total, aggregate consumption for my entire house. The value of sample at time t is the sum of the power being consumed by every appliance active at time t. The bottom trace shows the pure signature from four appliances, recorded using a smart plug. The data displayed in the top and bottom traces were recorded simultaneously. As you can see, the kettle and toaster signatures appear very clearly in the top trace. The washing machine and tumble drier signatures are also visible in the top trace but have been somewhat distorted.
There are two ultimate aims of a disaggregation algorithm:
- Infer which appliances are active within the smart meter signal
- Infer the quantity of energy used by each appliance
The main challenges
If we were only interested in disaggregating a small set of simple, two-state appliances like toasters and kettles then the disaggregation challenge would be fairly straight forward. What makes disaggregation a juicy computer science problem?
Challenge 1: mutliple states
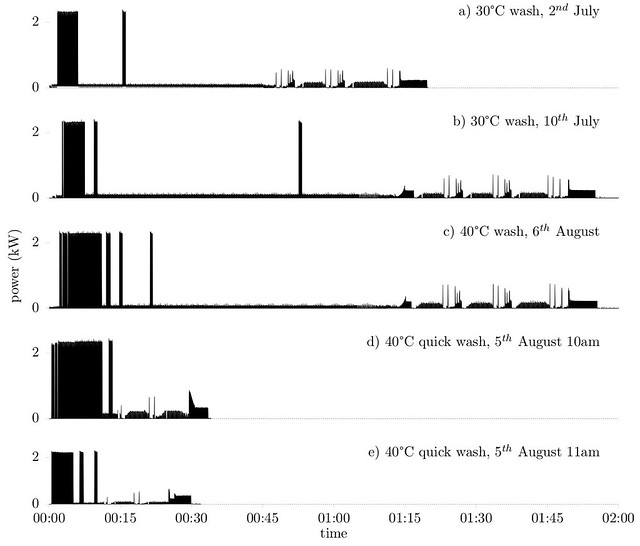
The first challenge is that many appliances have multiple states, and the state sequence differs from run to run. For example, here’s the power consumption of a single washing machine, run five times:
The large 2.3kW spikes are the washing machine’s water heater. The vast majority (all?) washing machines in the UK only have a cold-water input and hence must heat water using an electric heating element. Sometimes the washer turns the heater on twice. Sometimes three times. Sometimes six times. This variation makes it a little tricky to model complex multi-state appliances like washing machines.
Challenge 2: variation between appliances of the same class
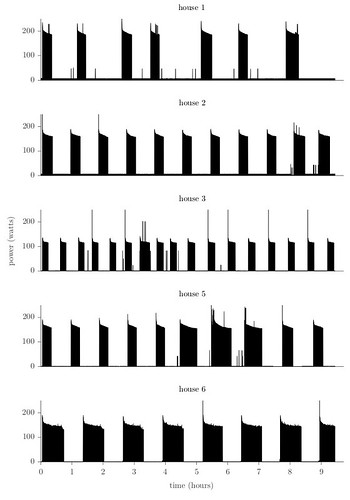
Here’s the power consumption from five different fridges:
(Five fridges. Data from REDD)
Challenge 3: different forms of occlusion
Consider the task of trying to locate a fridge signature in an aggregate signal. In what ways might the aggregate signal be affected by other appliances? Can we guarantee that the fridge signature will always be visible in the aggregate signal, no matter what the other appliances do? Or do we need to be aware of situations where the target signature might be obscured from view?
Best case scenario: no occlusion
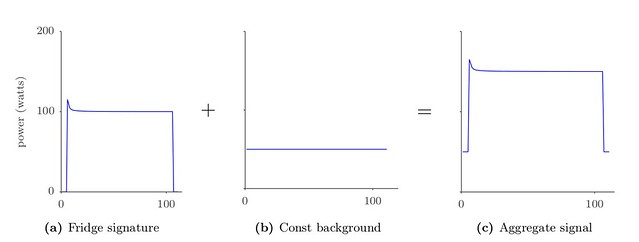
If the background is constant then the fridge signature is clearly identifiable:
Distorted but main discriminative features not occluded
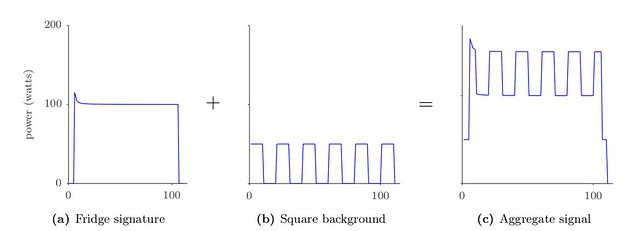
If the background is not constant then the fridge signature will be distorted but this distortion need not occlude the main discriminative features of the fridge signature. In the example shown in the figure below, the fridge signature is still visible: the +100 watt on-transition and the 100 watt off-transition are visible (because the background does not change at the precise moments the fridge changes state), as is the beginning of the downwards ramp.
Main features occluded
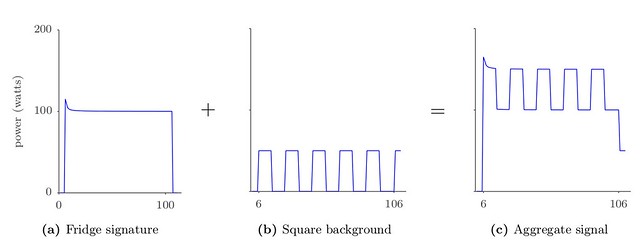
The figure below shows a square wave background which is very similar to the square wave in the figure above but with one important difference: this time, the square wave changes state precisely in sync with the fridge signature (at 6 and 106 seconds). What effect does this have?
Consider a disaggregation algorithm searching through the aggregate signal for the +100 watt on-transition and the -100 watt off-transition. The +100 watt on-transition has now become a +150 watt transition (because the fridge turned on precisely when the square wave turned on) and the -100 watt off-transition has become a -50 watt transition (because the fridge turned off precisely when the square wave turned on).
Worst case scenario: Totally occluded but fridge signature could be present
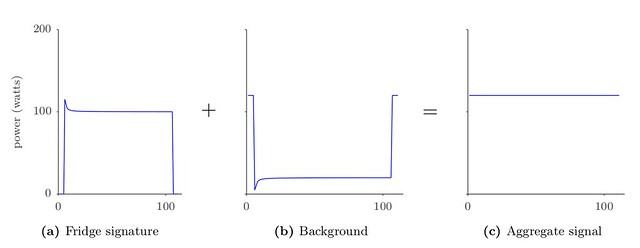
Here, the background has been generated by subtracting the fridge signature from 120. In the wild, it is extremely unlikely that the background will perfectly occlude the signature like this but it is possible.
Fridge signature cannot be present
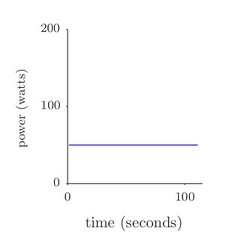
Compare the aggregate signal in the figure above (where the aggregate signal is a constant 120 watts) with the aggregate signal in the figure below (where the aggregate signal is a constant 50 watts). In the former, the fridge signature is totally occluded but we cannot rule out the possibility that the fridge signature is present. In the latter, we can say with total certainty that the fridge was not active during this time period because the aggregate signal stays as a constant 50 watts, whilst the fridge on its own consumes around 100 watts. This distinction between “definitely not present” and “not visible but could be present” may be important to bear in mind when designing the disaggregation algorithm.
Challenge 4: variation in mains voltage
The mains voltage in the UK is nominally 230 volts but can range from 216 volts to 253 volts which is -6%, +10% of the nominal 230 volt supply voltage (specs). Assuming a linear load, we can expect the power consumption to vary from by -12%, +20%.
Challenge 5: Some components generate identical signatures
For example, several devices include heaters (e.g. kettles, washing machines, dish washers, tumble driers etc). These heaters tend to be hard or impossible to distinguish in the aggregate signal. This is for two reasons. Firstly, heaters all tend to draw close to this maximum power available at the socket (for the UK, this maximum is 13 amps × 230 volts = 3 kW ). Secondly, heaters are the archetypal “pure resistive load” so every heater draws 100 % real power and 0 % reactive power
-
1.{.footnote-label} Other synonyms for “non-intrusive load monitoring” include “non-intrusive appliance load monitoring (NIALM)” or “non-instrusive appliance load monitoring system (NIALMS)”. We’ll stick with the simplest acronym to pronounce, NILM
-
2.{.footnote-label} Average UK household energy consumption: 20500 kWh gas + 3300 kWh electricity = 2.38 MWh total energy = 8.568×10^10^ Joules. Heat content of coal is roughly 3×10^7^ J/kg. \( {8.568\times10\^{10}\mathit{Joules} \over 3\times10\^{7}\mathit{J/kg}} = 2865\) kg coal.

