Visualisation of machine learning algorithms: computer science group project proposal
Here’s another computer science group project that I have submitted for consideration by students this coming year. As always, comments are very welcome!
Algorithms used in machine learning can often feel quite complex when you first come across them. As you gain experience with the algorithm you begin to be able to visualise each step and then realise that the algorithm is actually quite intuitive. Wouldn’t it have been far easier to learn the algorithm if you had seen a good visualisation of the algorithm to begin with!
For example, here’s a visualisation of selection sort (taken from WikiPedia):
The aim of this project is to produce interactive, animated visualisations of a set of machine learning algorithms. (Don’t worry if you don’t know any machine learning algorithms yet; this project would be a good opportunity to gain intimate knowledge of a few algorithms).
Below are some suggestions to get your ideas flowing. These really are just suggestions, you do not have to do any of these things. The design of the interface and the algorithm selection will be up to you!
-
Implement the interface as a web application using modern tools like HTML5 and SVG. Building a web application (rather than, say, a downloadable Java application) will not only make your system really easy for desktop users to access, but will also allow alternative platforms to access your visualisations (e.g. iPad and Android) . You could use the JavaScript library D3.js to help to build your visualisations.
-
As well as visualising the effect of the algorithm, also display a simple outline of how the algorithm works (perhaps using pseudo code or a control flow graph) and highlight which step of the algorithm is being executed at each time step in the visualisation. You could also animate the flow of information through the control flow graph. Below are some generic control flow graphs (from wikipedia).

- As well as (or instead of) visualising general machine learning algorithms, you could visualise specific systems from distant or recent history. For example, you could visualise code breaking algorithms like those developed by Alan Turing and colleagues at Bletchley Park during the Second World War to crack codes generated by the Enigma Machine. Or IBM Deep Blue’s chess playing system. Or bleeding edge speech recognition systems which use deep neural networks and hidden Markov models. Whatever takes your fancy.
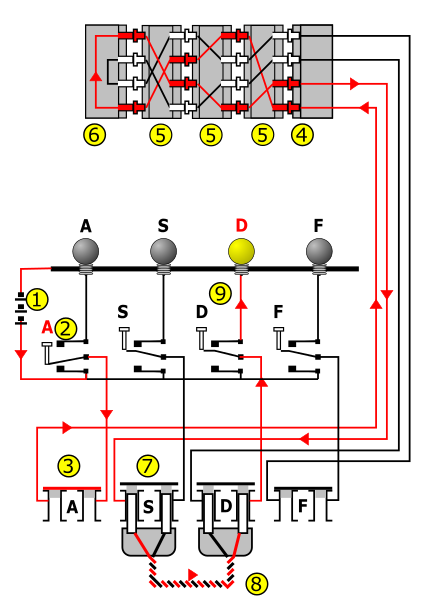
Here’s a (simplified) wiring diagram of the Engima machine (taken from WikiPedia):
-
If you can make your visualisations easy to “play” with then you’re onto a winner. e.g. if you visualise computer vision algorithm then allow the user to draw their own input images; perhaps allow users explore the details of the algorithm by clicking on the control flow graph to get more details of each step; perhaps even allow users to disconnect edges in the control flow graph to see the effect of breaking the algorithm in different ways.
-
As well as building interactive visualisations, it would be useful to create simple, stripped-down animations for inclusion on the WikiPedia page for each algorithm.
-
It would be nice to open source the project when you’re done, but that’s up to you.
-
In terms of which machine learning algorithms to visualise, algorithms which function on probabilistic graphical models might be especially ripe for visualisation (because graphical models are, by their nature, easy to visualise). Things like:
- the Viterbi algorithm (here’s an existing visualisation),
- Markov chain Monte Carlo (including some subclasses of MCMC like Gibbs sampling and some motivating examples of MCMC like simulating Ising models)
- the Expectation Maximisation algorithm for learning parameters in a hidden Markov model.
Further reading
- PyAlgoVis, A web app written in Python for visualising algorothms (thanks to Prof Andrew Davison for the link!)
- Take a look at the D3.js gallery to get a feel for what is possible with D3.js
- There’s an IEEE conference called “2014 9th International Conference on Computer Science & Education (ICCSE)” with abstract submission deadline 17th March 2014 and final paper submission deadline 15 May 2014 which might be interesting to apply to!
- Existing visualisations:
- WikiPedia articles on specific sorting algorithms have simple visualisations. e.g. insertion sort and selection sort
- ML Demos is a C++ machine learning visualisation framework.
- Sorting Algorithm Animations
- Data Structure Visualisations
- more Data Structure Visualisations written in Java
- Java Applet for visualising the EM Algorithm for estimating a Gaussian Mixture Model (Thanks to Nipun in the comments!)
- What different sorting algorithms sound like (!):
- http://dangerousminds.net/comments/the_sound_of_sorting_algorithms_write_incredible_new_kraftwerk_song
- Quick-sort with Hungarian folk dance:
- Insert-sort with Hungarian folk dance: